Analysis
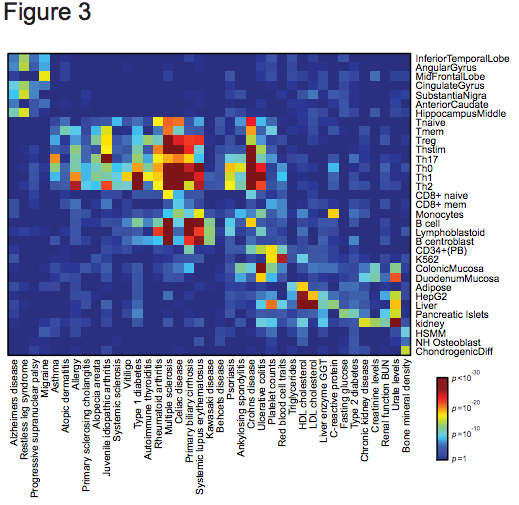
Figure 3 | Cell-type specificity of human diseases. Heatmap depicts enrichment (red=high; blue=low) of PICS SNPs for 39 diseases/traits in acetylated cis-regulatory elements of 33 different cell types.
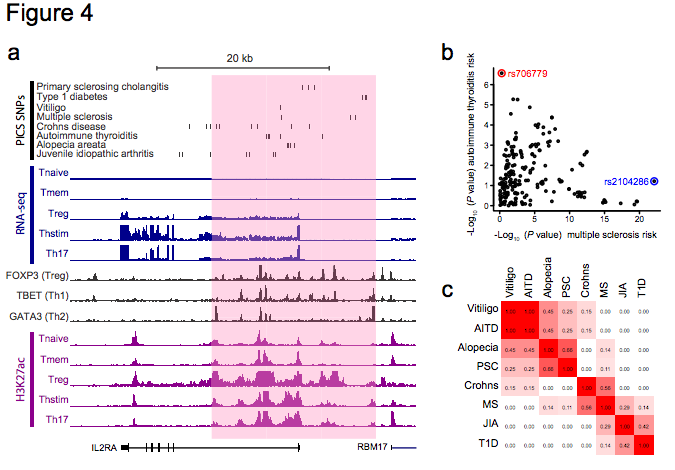
Figure 4 | Disease variants map to discrete elements in super-enhancers. a, Candidate causal SNPs for autoimmune diseases are displayed along with H3K27ac, RNA-seq and TF binding profiles for the IL2RA locus, which contains a super-enhancer (pink shade). b, For all SNPs in the IL2RA locus, scatter plot compares strength of association with MS versus autoimmune thyroiditis. Immunochip data resolve rs706779 (red) as the lead SNP for autoimmune thyroiditis and rs2104286 (blue) as the lead SNP for MS. c, LD matrix displaying r2 between lead SNPs for different diseases at the IL2RA locus confirms distinct and independent genetic associations within the super-enhancer.
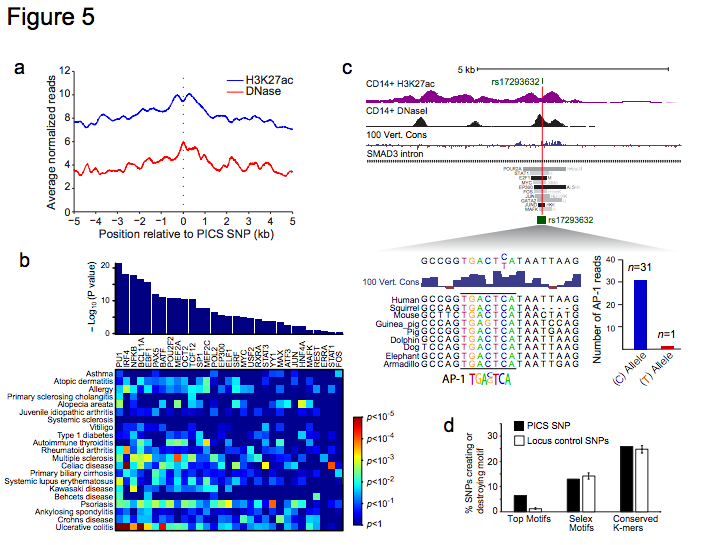
Figure 5 | Causal variants map to regions of TF binding. a, Plot depicts composite H3K27ac and DNase signals26 in immune cells over PICS autoimmunity SNPs. PICS SNPs overall coincide with nucleosome-depleted, hypersensitive sites, indicative of TF binding. b, Bar plot indicates TFs whose binding is enriched near PICS SNPs for all 21 autoimmune diseases26. Heatmap depicts enrichment of these TFs near variants associated with specific diseases (red:high; blue:low). c, H3K27ac, DNaseI26 and conservation signals, and selected TF binding intervals are shown in a SMAD3 intronic locus. rs17293632, a noncoding candidate causal SNP for Crohn’s disease, disrupts a conserved AP-1 binding motif in an enhancer marked by H3K27ac in CD14+ monocytes. Summing of ChIP-seq reads overlapping the SNP in the heterozygous HeLa cell line shows that only the intact motif binds AP-1 TFs, Jun and Fos. d, Bar graph shows the fraction of PICS SNPs (black) versus random SNPs from the same locus (white) that create or disrupt one of the significantly enriched motifs, any Selex motif, or any conserved K-mer. Error bars indicate standard deviation from 1000 iterations using locus-matched control SNPs.
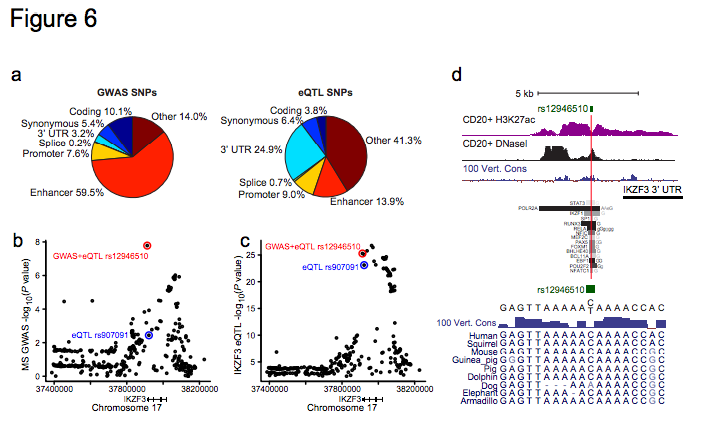
Figure 6 | Functional Effects of Disease Variants on Gene Expression. a, Pie charts show the fraction of PICS autoimmunity SNPs (left) or peripheral blood eQTLs (right) explained by the indicated genomic features. b, GWAS signal for MS risk at the IKZF3 locus. The minor allele of rs12946510 (red) is associated with both disease risk and eQTL effect (decreased IKZF3 expression), while the minor allele of rs907091 (blue) scored as eQTL only (increased IKZF3 expression). c, eQTL association signal for IKZF3 shown for the same regions as in b. d, H3K27ac, DNaseI and conservation signals, and selected TF binding intervals are shown in the vicinity of rs12946510, which occurs in a conserved site marked by H3K27ac in multiple cell types, including CD20+ B-cells, and bound by multiple TFs. The C/T variation at this SNP does not disrupt any clearly defined DNA motif, but coincides with a degenerate MEF2 motif.