Genetic and Epigenetic Fine-Mapping of Causal Variants in Autoimmune Disease
Kyle Kai-How Farh, Alexander Marson, Jiang Zhu, Markus Kleinewietfeld, William J. Housley,Samantha Beik, Noam Shoresh, Holly Whitton, Russell J. H. Ryan, Alexander A. Shishkin, Meital Hatan, Marlene J. Carrasco-Alfonso, Dita Mayer, C. John Luckey, Nikolaos A. Patsopoulos, Philip L. De Jager, Vijay K. Kuchroo, Charles B. Epstein, Mark J. Daly, David A. Hafler & Bradley E. Bernstein
Nature 518, 337–343 (19 February 2015)
Summary
Genome-wide association studies have identified loci underlying human diseases, but the causal nucleotide changes and mechanisms remain largely unknown. Here we developed a fine-mapping algorithm to identify candidate causal variants for 21 autoimmune diseases from genotyping data. We integrated these predictions with transcription and cis-regulatory element annotations, derived by mapping RNA and chromatin in primary immune cells, including resting and stimulated CD4+ T-cell subsets, regulatory T-cells, CD8+ T-cells, B-cells, and monocytes. We find that ~90% of causal variants are noncoding, with ~60% mapping to immune-cell enhancers, many of which gain histone acetylation and transcribe enhancer-associated RNA upon immune stimulation. Causal variants tend to occur near binding sites for master regulators of immune differentiation and stimulus-dependent gene activation, but only 10-20% directly alter recognizable transcription factor binding motifs. Rather, most noncoding risk variants, including those that alter gene expression, affect non-canonical sequence determinants not well-explained by current gene regulatory models.
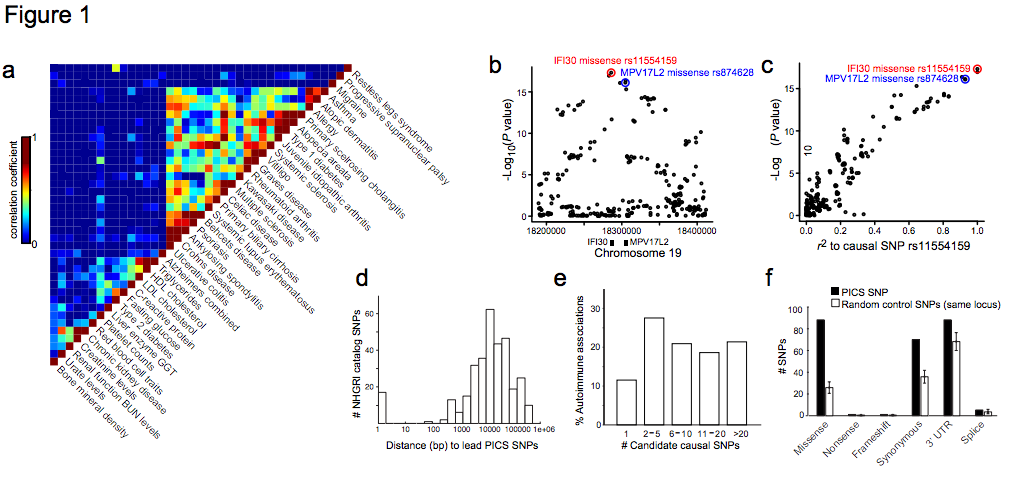
Figure 1 | Genetic fine-mapping of human disease. a, GWAS catalog loci were clustered to reveal shared genetic features of common human diseases and phenotypes. Color scale indicates correlation between phenotypes (high=red, low=blue). b, Association signal to MS for SNPs at the IFI30 locus. c, Scatter plot of SNPs at the IFI30 locus demonstrates the linear relationship between LD distance (r2) to rs1154159 (red) and association signal. d, Candidate causal SNPs were predicted for 21 autoimmune diseases using PICS. Histogram indicates genomic distance (bp) between PICS Immunochip lead SNPs and GWAS catalog index SNPs. e, Histogram indicates number of candidate causal SNPs per GWAS signal needed to account for 75% of the total PICS probability for that locus. f, Plot shows correspondence of PICS SNPs to indicated functional elements, compared to random SNPs from the same loci (error bars indicate standard deviation from 1000 iterations using locus-matched control SNPs).
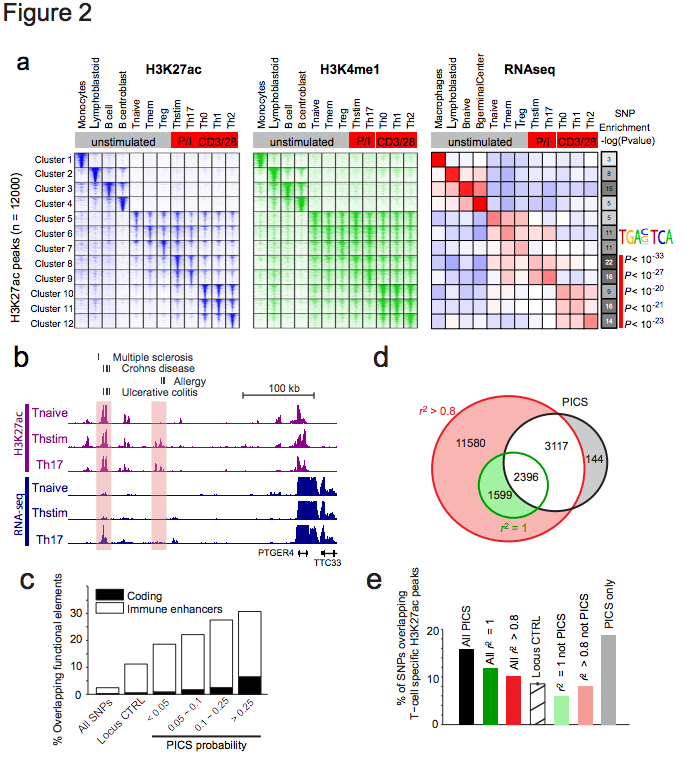
Figure 2 | Epigenetic fine-mapping of enhancers. a, Heatmaps show H3K27ac and H3K4me1 signals for 1000 candidate enhancers (rows) in 12 immune cell types (columns). Enhancers are clustered by the cell type-specificity of their H3K27ac signals. Adjacent heatmap shows average RNA-seq expression for the genes nearest to the enhancers in each cluster. Gray-scale (right) depicts the enrichment of PICS autoimmunity SNPs in each enhancer cluster (hypergeometric p-values calculated based on the number of PICS SNPs overlapping enhancers from each cluster, relative to random SNPs from the same loci). The AP-1 motif is over-represented in enhancers preferentially marked in stimulated T-cells, compared to naïve T-cells. b, Candidate causal SNPs displayed along with H3K27ac and RNA-seq signals at the PTGER4 locus. A subset of enhancers with disease variants (shaded) shows evidence of stimulus-dependent eRNA transcription. c, Stacked bar graph indicates percentage overlap with immune enhancers and coding sequence for PICS SNPs at different probability thresholds, compared to control SNPs drawn from the entire genome (All SNPs) or the same loci (Locus CTRL). d, Venn diagram compares PICS SNPs to GWAS catalog SNPs with indicated r2 thresholds. e, Bar graph indicates percentage overlap with annotated T-cell enhancers for PICS SNPs, GWAS SNPs at indicted thresholds, locus control SNPs, and three subsets of SNPs defined and shaded as in panel d.